Ubiquiti AirView - Анализатор спектра беспроводных сетей Wi-Fi 802.11b/g ( 2.399-2.485 Ггц, USB 1.1/2.0, Windows / Linux )
Недоступно для заказа
Available Models
AirView2, AirView2-EXT, AirView9, AirView9-EXT
Increasingly crowded 2.4GHz Band
The worldwide unlicensed 2.4GHz band is becoming increasingly crowded. Cordless phones, baby monitors, alarm systems, and a massive collection of wifi devices all battle with each other to share the same medium for communication.
For many professional installers, analyzing the 2.4GHz spectrum to determine the optimum setup for new wireless equipment is imperative. Typically, this is done with a tool called a "Spectrum Analyzer", costing from several hundreds to tens of thousands of dollars, which is capable of displaying the distribution of RF energy in the 2.4GHz band.
Powerful Performance, Breakthrough Price
Ubiquiti's AirView is a revolutionary product which consists of a tiny USB module, that when paired with a common laptop or PC, transforms into a powerful Spectrum Analyzer at a market breakthrough MSRP $39USD price point.
The AirView Spectrum Analyzer is useful in studying all RF energy contributors in the 2.4GHz band, but has particularly useful tools that make it ideal for optimizing 2.4GHz WiFi Networks. AirView is available in four different models: AirView2 (2.4GHz), AirView2-EXT (2.4GHz, external antenna), AirView9 (900MHz), AirView9-EXT (900MHz, external antenna).
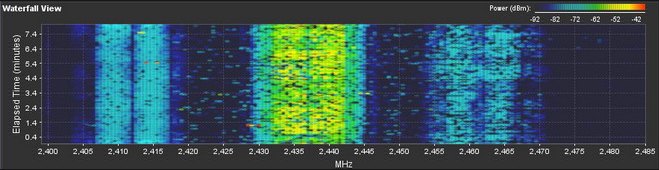
Waterfall Chart
This time-based graph shows the aggregate energy collected since the start of an AirView session, over time for each frequency. The power of the energy in dBm is shown across the frequency span and one row is inserted in this graph every few seconds.
It is important to note that the color of the energy designates its amplitude. The darker colors (Blues and darker shades) mean very low to low energy levels at that frequency bin, whereas increasingly brighter colors (ie: Green, Yellow, Orange, and finally Red) designate increasingly higher energy levels at the specific frequency bin.
The Waterfall View's legend (top-right corner) provides a numerical guide associating the various colors to power levels (dBm). The low end of that legend (left) is always adjusted with the calculated noise floor, and the high end (right) is set to the highest detected power level since the start of the session.
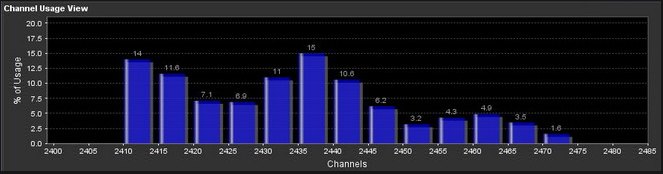
Channel Usage Chart
This graph is ideal for determining the best channel to setup a WiFi network for optimal performance. In the graph, each 2.4GHz WiFi channel is represented by a bar displaying a percentage representing the relative "crowdedness" of that specific channel.This percentage is calculated by analyzing both the popularity and the strength of RF energy in that channel since the start of a AirView session. An installer could use this view to optimize a network installation by avoiding highly used channels and setting up new AP's on channels showing the least usage.
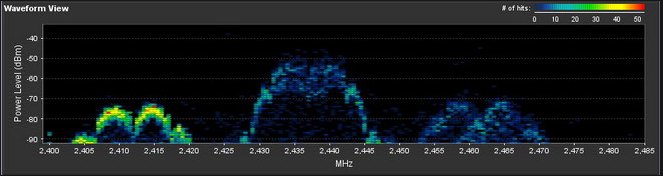
Waveform Chart
This graph shows the aggregate energy collected since the start of an AirView Session. The power of the energy in dBm is shown across the frequency span. A Blue color will mean energy at a particular strength and frequency appears in the air with a relatively low occurence, whereas increasingly brighter colors (ie: Green, Yellow, Orange, and finally Red) designate energy appearing at a specific power/frequency with higher occurrence. The spectral view over time will essentially display the steady-state RF energy signature of a given environment. An installer could use this view to optimize a network installation by avoiding highly used channels and setting up new AP's on channels showing the least usage.
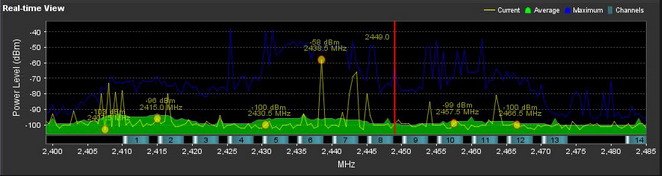
Real-time Chart
This graph displays a traditional Spectrum Analyzer in which energy (in dBm) is shown real-time as a function of frequency. There are three traces in this view: Max Hold, this trace will update and hold maximum power levels across the frequency since the start of an AirView session. Average, this trace shows the running average energy across frequency. Real-time, this trace shows the real-time energy seen by the AirView device as a function of frequency.
System Requirements
Windows XP, Vista, Apple OSX, Linux (certain limitations apply)
Interface USB 1.1 or 2.0
Frequency Range (Model Dependent) 2.399-2.485 GHz (Airview2/EXT) or 895-935 MHz (Airview9/EXT)
Sweep Time 260ms
Weight 0.1kg